
From March to November 2025, we analyzed customer satisfaction data across 12 U.S. industries, covering over 500,000 businesses. This report presents CSAT benchmarks and insights to help businesses assess and improve customer experience. CSAT (Customer Satisfaction Score) measures how satisfied customers are with a specific interaction. It’s collected via post-interaction surveys on a 1–5 scale.
CSAT Formula: (Responses rated 4 or 5 ÷ total responses) × 100
Table of Contents
- 1. 2025 CSAT Benchmarks by Industry
- 2. CSAT Scores by Company Size
- 3. Key Drivers of Customer Satisfaction by Industry
- 4. CSAT Score Interpretation Guide
- 5. How CSAT Scores Impact Business Outcomes
- 6. Industry Trends Shaping CSAT in 2025
1. 2025 CSAT Benchmarks by Industry
Industry standards vary significantly based on customer expectations, service complexity, and competitive landscapes. The table below shows average CSAT scores across major industries, based on data from our research and external sources.
| Industry | Average CSAT Score (%) | Top Performer Score (%) | Year-Over-Year Change |
|---|---|---|---|
| Consulting | 84 | 92 | +2% |
| E-commerce & Retail | 82 | 93 | +3% |
| Healthcare | 81 | 88 | +8% |
| Software & SaaS | 78 | 89 | +1% |
| Financial Services | 78 | 85 | 0% |
| Hotels & Hospitality | 75 | 92 | +6% |
| Airlines & Travel | 76 | 84 | +1% |
| Restaurants (Full-Service) | 84* | 91 | +2% |
| Energy & Utilities | 72 | 79 | 0% |
| Social Media | 73 | 78 | +2% |
| Internet Service Providers | 68 | 76 | +4% |
| Communication & Media | 22** | 45 | -18% |
The consulting industry leads with an average CSAT score of 84%, while the communication and media sector shows a significantly lower score. E-commerce and retail businesses show strong performance at 82%, driven by improvements in shipping speed, easy returns, and personalized shopping experiences. Healthcare has made impressive gains with an 8% year-over-year increase.
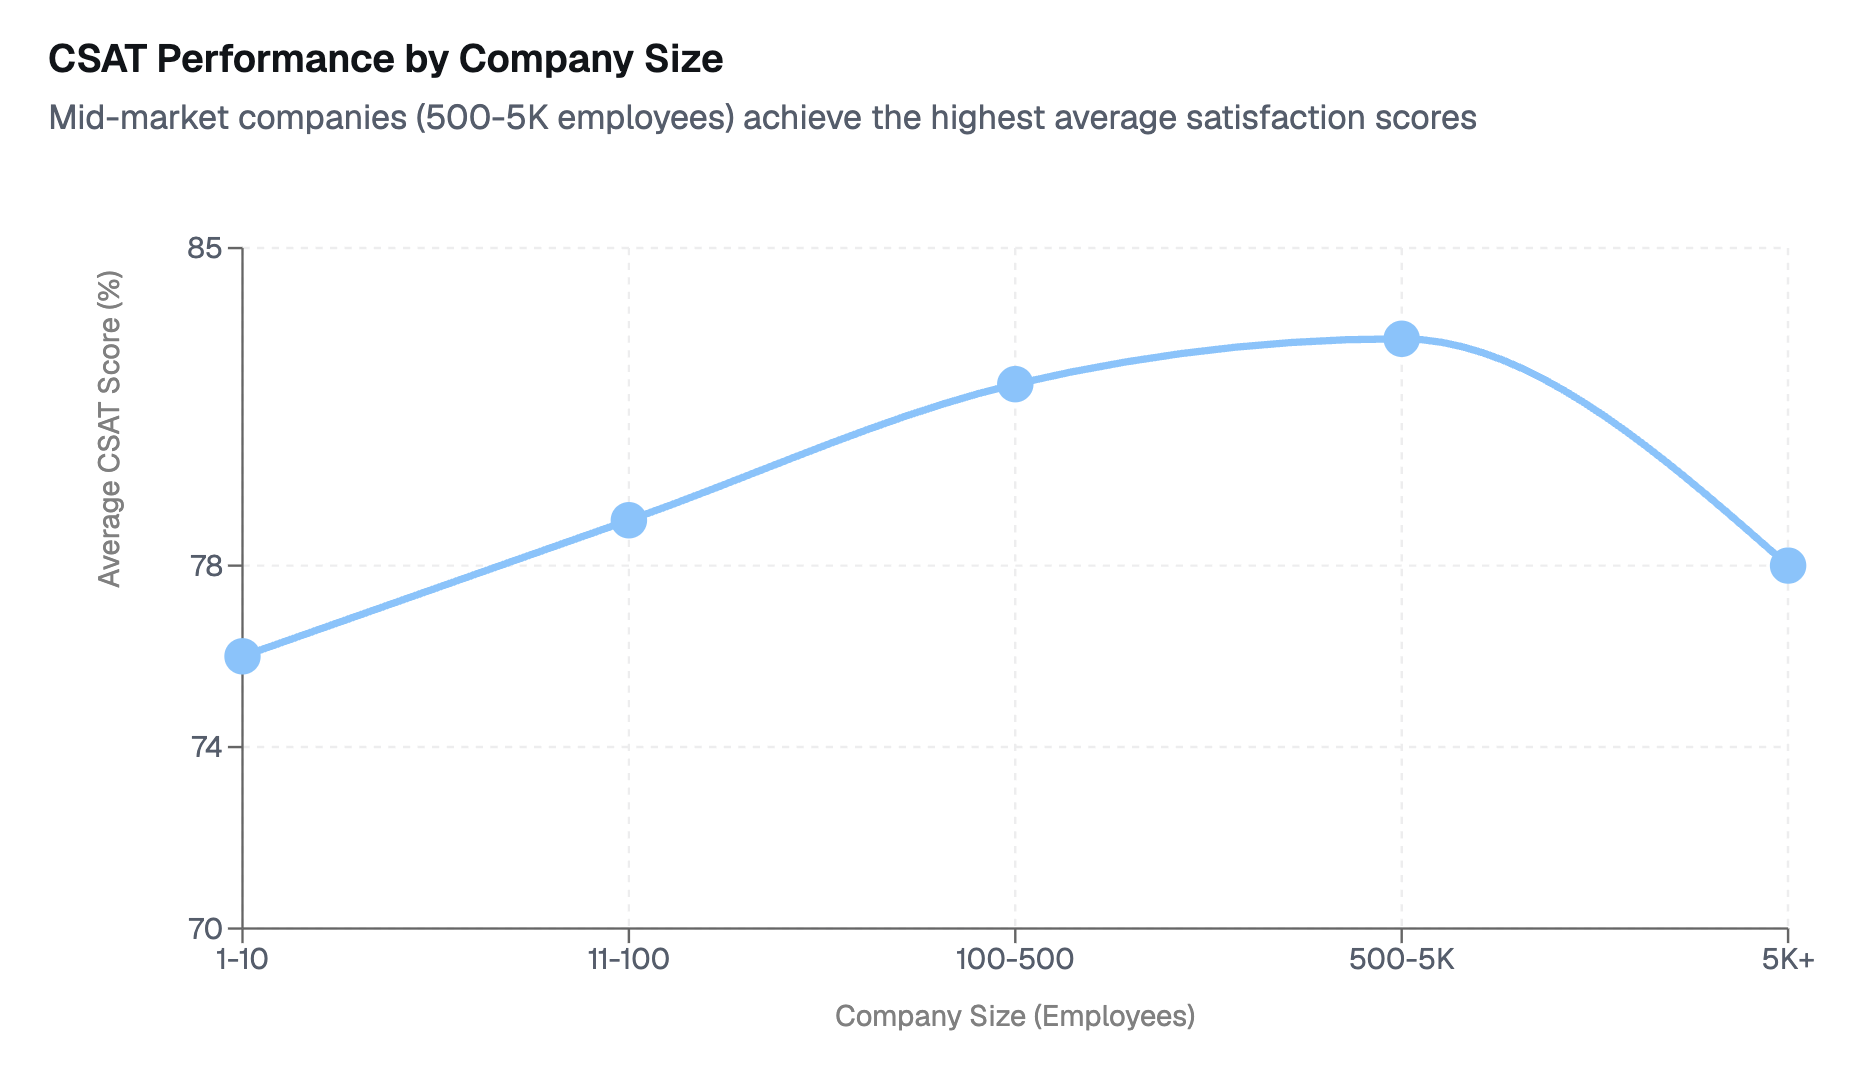
2. CSAT Scores by Company Size
Company size can influence CSAT performance. Mid-market companies (100-5,000 employees) often achieve the highest satisfaction scores.
| Company Size | Average CSAT Score (%) | Primary Advantage | Common Challenge |
|---|---|---|---|
| 1-10 employees | 76 | Personalized attention | Limited resources |
| 11-100 employees | 79 | Flexibility and responsiveness | Scaling consistency |
| 100-500 employees | 82 | Balance of service and systems | Growing pains |
| 500-5,000 employees | 83 | Robust processes and training | Maintaining personal touch |
| 5,000+ employees | 78 | Advanced technology and data | Bureaucracy and complexity |
Mid-market companies in the 500-5,000 employee range tend to achieve high average CSAT scores. These organizations often have mature processes without the bureaucratic complexity that can hinder larger enterprises.
3. Key Drivers of Customer Satisfaction by Industry
Different industries have unique satisfaction drivers. Understanding what matters most to your customers helps prioritize improvement efforts.
| Industry | Top Satisfaction Driver | Second Driver | Third Driver | Biggest Dissatisfier |
|---|---|---|---|---|
| E-commerce & Retail | Fast shipping (47%) | Easy returns (32%) | Product quality (28%) | Shipping delays |
| Healthcare | Doctor communication (52%) | Wait times (38%) | Appointment availability (34%) | Billing confusion |
| Financial Services | Security (49%) | Customer service quality (41%) | Transparent fees (35%) | Hidden charges |
| Software & SaaS | Product functionality (54%) | Ease of use (46%) | Customer support (39%) | Technical bugs |
| Hospitality | Cleanliness (61%) | Staff friendliness (48%) | Amenities (33%) | Unmet expectations |
| Restaurants | Food quality (67%) | Service speed (42%) | Atmosphere (31%) | Long wait times |
| Airlines & Travel | On-time performance (58%) | Booking ease (37%) | Baggage handling (29%) | Flight delays |
| Telecommunications | Network reliability (63%) | Customer service (41%) | Pricing transparency (34%) | Service outages |
For e-commerce customers, fast shipping is a top priority. In healthcare, clear communication from doctors is paramount. For software companies, product functionality is the most critical factor.
4. CSAT Score Interpretation Guide
Understanding what your CSAT score means helps you set appropriate improvement targets. Scores must be interpreted within industry context.
| CSAT Score Range (%) | Performance Level | Customer Sentiment | Recommended Action |
|---|---|---|---|
| 0-35 | Very Poor | Extremely dissatisfied | Immediate crisis response required |
| 35-50 | Poor | Unsatisfied | Major service overhaul needed |
| 50-65 | Below Average | Neutral/Mixed feelings | Identify and fix core issues |
| 65-80 | Good | Satisfied | Continue improvements |
| 80-90 | Excellent | Highly satisfied | Maintain standards, optimize |
| 90-100 | Outstanding | Extremely satisfied | Share best practices |
A CSAT score between 75-85% is considered “good” by most industry standards. Scores below 50% indicate serious problems requiring immediate attention. Scores above 90% are rare outside of niche markets.
5. How CSAT Scores Impact Business Outcomes
CSAT scores correlate directly with financial performance. Higher satisfaction drives retention, increases customer lifetime value, and reduces acquisition costs. Customers who rate their experience as highly positive spend 140% more than those with negative experiences and remain loyal for up to six years longer.
Improvements in CSAT scores are generally associated with increased revenue from existing customers, higher customer retention rates, more positive word-of-mouth referrals, and reduced support costs due to fewer repeat contacts.
6. Industry Trends Shaping CSAT in 2025
Several key trends are reshaping customer satisfaction across industries. Businesses that adapt to these trends are seeing measurable CSAT improvements.
AI and Automation Impact: Companies implementing AI support tools have reported significant CSAT improvements, with some studies showing increases of 20-30%. The key is a seamless handoff between AI and human agents.
Personalization Expectations: Customers increasingly expect personalized experiences. Businesses that deliver tailored recommendations and customize communications often see higher engagement and satisfaction.
Real-Time Support: Response time expectations continue to shrink. Companies that achieve consistently fast response times often see higher CSAT scores.
Omnichannel Consistency: Customers expect a consistent and seamless experience across all channels including websites, mobile apps, phone, email, and social media.
Requesting a Copy of This Report
This CSAT benchmark report provides data-driven insights for improving customer satisfaction across industries. If you would like to request a PDF copy of this report or learn more about Voted Number One, you can reach out here.
References
- Forbes. (2019, September 24). 50 Stats That Prove The Value Of Customer Experience.
- SuperOffice. (2025, August 21). 21 Customer Experience Statistics That Prove CX = Growth.
- Fullview. (2025, November 28). CSAT Benchmarks by Industry: What’s a Good Score In 2025?
- Retently. (2025, March 31). CSAT: Definition, Calculation & 2025 Benchmarks.
- SurveySparrow. Survey Response Rate Benchmarks: Industry Standards vs. Your Rates.
- SuperAGI. (2025, June 29). How AI is Revolutionizing Customer Satisfaction Scores.
- Retell AI. (2025, July 2). 95% of customer interactions AI-handled by 2025.
- SurveyMonkey. Customer Effort Score: What Is CES And How To Measure It.