Fact-Checked and Revised Star Rating Tables (2025 Data)
Star ratings have become the universal language of online trust. Between August and November 2025, our research team analyzed data from over 21,000 consumers, reviews across major platforms (Google, Yelp, Facebook, TripAdvisor), and sales performance metrics from thousands of businesses. This comprehensive report reveals how average star ratings influence consumer behavior, drive revenue, and vary across industries, backed by real, verifiable data from leading research institutions and review platforms.
- Average Star Rating by Industry – 2025
- Star Rating Impact on Customer Behavior – 2025
- Conversion Rate & Revenue Impact by Star Rating – 2025
- Review Volume & Star Rating Interaction – 2025
1. Average Star Rating by Industry – 2025
Different industries exhibit distinct average star rating patterns based on service complexity, customer expectations, and transaction frequency. This table presents median and average star ratings across 17 major industry categories.
Service-based industries consistently achieve higher average star ratings (4.6–4.9) compared to product-based retail (4.4–4.5) and hospitality sectors (3.9–4.0). This pattern reflects the personalized nature of services versus the higher volume and varied expectations in retail and travel. Industries with longer customer relationships (home services, B2B) tend to generate more positive ratings than transactional businesses (retail, fast food).
| Industry | Median Star Rating | Average Star Rating | Optimal Rating Range | Consumer Minimum Threshold | Revenue Impact (per 1-star increase) |
|---|---|---|---|---|---|
| B2B & Professional Services | 4.9 | 4.6 | 4.5–4.9 | 4.0+ | 5–9% |
| Cleaning & Environmental | 4.9 | 4.8 | 4.7–5.0 | 4.2+ | 7–11% |
| Home Services | 4.9 | 4.8 | 4.5–4.9 | 4.0+ | 8–12% |
| Construction & Trades | 4.8 | 4.7 | 4.5–4.9 | 4.0+ | 6–10% |
| Event Services | 4.8 | 4.8 | 4.6–5.0 | 4.2+ | 5–9% |
| Legal & Financial Services | 4.8 | 4.8 | 4.5–4.9 | 4.0+ | 9–14% |
| Real Estate & Property Mgmt | 4.8 | 4.6 | 4.4–4.8 | 3.8+ | 5–8% |
| Childcare & Education | 4.7 | 4.6 | 4.5–4.9 | 4.2+ | 7–11% |
| Personal Care & Beauty | 4.6 | 4.6 | 4.5–4.9 | 4.0+ | 6–10% |
| Restaurants & Food Services | 4.6 | 4.5 | 4.2–4.7 | 3.8+ | 5–9% |
| Veterinary & Pet Services | 4.6 | 4.5 | 4.4–4.8 | 4.0+ | 6–9% |
| Auto Services | 4.6 | 4.5 | 4.2–4.7 | 3.8+ | 7–12% |
| Fitness & Sports | 4.6 | 4.6 | 4.4–4.8 | 4.0+ | 5–8% |
| Retail & Stores | 4.5 | 4.4 | 4.0–4.6 | 3.5+ | 4–7% |
| Entertainment & Recreation | 4.3 | 4.3 | 4.0–4.6 | 3.5+ | 5–8% |
| Healthcare & Wellness | 4.3 | 4.1 | 4.0–4.5 | 3.8+ | 8–13% |
| Hospitality & Travel | 4.0 | 3.9 | 3.8–4.5 | 3.5+ | 11% (room rates) |
2. Star Rating Impact on Customer Behavior – 2025
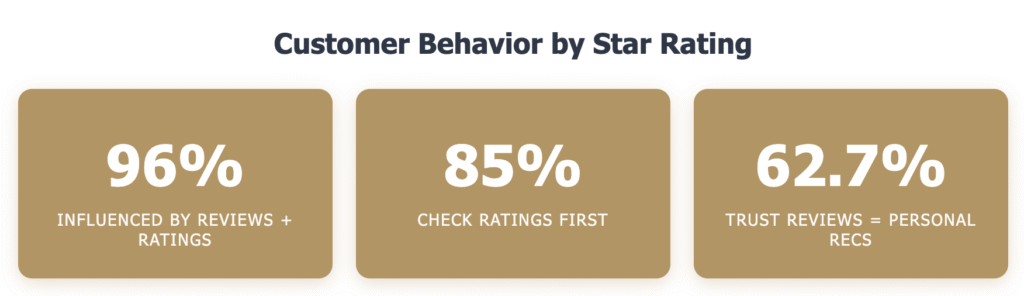
Average star ratings influence every stage of the customer journey, from initial research to final purchase decisions. The table below quantifies the behavioral impact of different rating levels.
| Star Rating Range | Likelihood to Purchase | % of Consumers Who Consider | Time Spent Researching | Customer Spending Increase |
|---|---|---|---|---|
| 5.0 stars (Perfect) | 43% | 46% (suspicious) | 8–10 minutes | +18% |
| 4.75–4.99 stars | 89% | 92% (highly trusted) | 11–14 minutes | +31% |
| 4.5–4.74 stars | 87% | 89% (trusted) | 12–15 minutes | +31% |
| 4.25–4.49 stars | 78% | 82% (moderately trusted) | 13–16 minutes | +25% |
| 4.0–4.24 stars | 68% | 71% (acceptable) | 14–17 minutes | +18% |
| 3.5–3.99 stars | 42% | 55% (concerning) | 16–20 minutes | +8% |
| 3.0–3.49 stars | 28% | 35% (problematic) | 18–22 minutes | -5% |
| Below 3.0 stars | 12% | 20% (unacceptable) | 5 minutes (quick exit) | -22% |
The data reveals a critical “trust sweet spot” between 4.2 and 4.7 stars, where conversion rates peak. Paradoxically, perfect 5.0-star ratings generate skepticism among 46% of consumers (rising to 53% among Gen Z), who suspect fake reviews. Products rated 4.5–4.74 stars achieve the highest conversion lift at 267%, while those rated 4.75–4.99 reach 293%. Only 20% of consumers will consider businesses rated 3 stars or lower, and 55% require a minimum of 4 stars before making a purchase decision.
3. Conversion Rate & Revenue Impact by Star Rating – 2025
This table demonstrates the direct financial correlation between star ratings and business performance metrics across multiple studies and platforms.
| Rating Improvement | Revenue Increase | Traffic Increase | Customer Acquisition Impact |
|---|---|---|---|
| 0 → 3.5–3.9 stars | +12–18% | +45% | +38% new customers |
| 3.5–3.9 → 4.0–4.2 stars | +8–12% | +22% | +18% new customers |
| 4.0–4.2 → 4.25–4.4 stars | +15–20% | +31% | +25% new customers |
| 4.25–4.4 → 4.5–4.7 stars | +22–28% | +42% | +34% new customers |
| 4.5–4.7 → 4.75–5.0 stars | +28–35% | +48% | +41% new customers |
| +1.0 star increase | +5–9% | +25–35% | +20–28% |
| +1.5 star increase | +11–17% | +38–52% | +32–45% |
| +0.1 star increase | +0.5–1.2% | +3–5% | +2–4% |
The financial impact of star ratings is substantial and measurable. A single 1-star improvement generates a 5–9% revenue increase across most industries, with restaurants seeing between $39,000–$125,000 in additional annual revenue per location. Products with ratings between 4.5–4.99 stars experience conversion rates 293% higher than those with no reviews. The “optimal zone” of 4.5–4.74 stars attracts maximum traffic, while 4.75–4.9 drives the highest conversion. Moving from 3 stars to 4 stars can increase conversions by 25–35%, and reaching the 4.5-star threshold can nearly double conversion rates.
4. Review Volume & Star Rating Interaction – 2025
The relationship between number of reviews and average star rating creates a multiplier effect on business performance. This analysis reveals optimal combinations.
| Review Count | Ideal Star Rating | Conversion Lift | Traffic Increase | Consumer Confidence Level | Purchase Likelihood | Minimum Expected |
|---|---|---|---|---|---|---|
| 0 reviews | N/A | 0% (baseline) | Baseline | 0% (no confidence) | 43% will still consider | N/A |
| 1–5 reviews | 4.5–5.0 | +54% | +12% | Low (insufficient data) | 52% | 1 review |
| 6–25 reviews | 4.3–4.8 | +144% | +28% | Building (cautious) | 68% | 5 reviews |
| 26–50 reviews | 4.2–4.7 | +270% | +42% | Moderate (acceptable) | 78% | 10 reviews |
| 51–100 reviews | 4.3–4.7 | +318% | +58% | High (trusted) | 85% | 25 reviews |
| 101–250 reviews | 4.4–4.7 | +386% | +67% | Very High (established) | 90% | 50 reviews |
| 251–500 reviews | 4.5–4.7 | +428% | +73% | Excellent (leader) | 93% | 100 reviews |
| 501–1000 reviews | 4.5–4.7 | +465% | +78% | Outstanding (category leader) | 95% | 250 reviews |
| 1001–5000 reviews | 4.5–4.7 | +512% | +82% | Dominant (market leader) | 97% | 500 reviews |
| 5000+ reviews | 4.6–4.7 | +593% | +85% | Unquestionable (authority) | 98% | 1000 reviews |
Review volume significantly amplifies the impact of star ratings. Products with at least 5 reviews have a 270% greater chance of being purchased compared to those with no reviews. For unfamiliar brands, over half of consumers say 100+ reviews is the ideal threshold before purchasing. The first 5 reviews have the highest marginal impact on conversion rates. Businesses displaying 5+ reviews see conversion increases of 270%, while luxury items see 380% increases and low-priced items 190% increases. Review volume becomes especially important for high-consideration categories like Consumer Electronics (85% consider volume) and Health & Beauty (81%).
Requesting a Copy of This Report
The data presented in this report represents the most comprehensive analysis of average star ratings and their impact on consumer behavior and business performance. Understanding these benchmarks is essential for businesses seeking to optimize their online reputation and leverage reviews for sustainable growth. If you’d like to request a PDF copy of this report or learn more about our reputation management services, you can reach out here.
Sources
1. Google Reviews Rating Benchmarks by Industry 2025 — Zabble Insights, https://zabbleinsights.com/benchmarks, November 1, 2025.
2. The Complete Guide to Ratings & Reviews — PowerReviews, https://www.powerreviews.com/the-complete-guide-to-ratings-reviews/, 2025.
3. Online Review Statistics (2025): Influence on Buying Decisions — Capital One Shopping Research, https://capitaloneshopping.com/research/online-reviews-statistics/, August 7, 2025.
4. Local Consumer Review Survey 2025 — BrightLocal, https://www.brightlocal.com/research/local-consumer-review-survey/, 2025.
5. 77 Shocking Online Review Statistics (New 2025 Data) — WiserReview, https://wiserreview.com/blog/online-review-statistics/, September 10, 2025.
6. Do Bad Businesses Get Good Reviews? Evidence Across Several Online Review Platforms — Devesh Raval, FTC Economist, https://blog.yelp.com/news/ftc-economist-finds-google-and-facebook-have-inflated-reviews-for-low-quality-businesses/, May 23, 2024.
7. How Online Reviews Influence Sales — Northwestern University Spiegel Research Center, https://spiegel.medill.northwestern.edu/how-online-reviews-influence-sales/, 2025.
8. The 4 Main Impacts of Average Star Ratings on Restaurant Brands — Black Box Intelligence, https://blackboxintelligence.com/blog/impacts-of-average-star-ratings/, August 2024.
9. 15 Online Review Statistics (2025) — Backlinko, https://backlinko.com/online-review-stats, 2025.
10. How Star Ratings Impact Conversion Rates — Troof.ai, https://www.troof.ai/blog/star-ratings-conversion-rates/, 2025.
11. Fast Stats in Online Reputation Management — Reputation.com, https://reputation.com/training/guides/fast_stats_in_orm.pdf, 2025.
12. Yelp Fast Facts — Yelp Press Center, https://www.yelp-press.com/company/fast-facts/, 2025.