From December 2025 through January 2026, our research team compiled profit margin data from more than 5,900 businesses across 143 industry sectors, with additional analysis of small business financial benchmarks from academic institutions and industry reporting agencies. The dataset combines sector-level margin reporting from NYU Stern School of Business, small business profitability research from financial institutions, and industry-specific performance data.
The following report presents average small business profit margins segmented by industry category, business size, and operational model. We define profit margin as net income divided by total revenue, expressed as a percentage. Small businesses are defined as enterprises with fewer than 500 employees and annual revenue under $50 million, consistent with U.S. Small Business Administration classification standards.
1. Average Small Business Profit Margin by Industry – 2026
The table below presents net profit margin benchmarks across 20 major small business categories. Net profit margin represents the percentage of revenue remaining after all expenses, including cost of goods sold, operating expenses, interest, and taxes.
Industry benchmarksNet + Gross margins, cost drivers, volatility
| Industry | Average Net Profit Margin | Gross Profit Margin | Primary Cost Drivers | Margin Volatility |
|---|---|---|---|---|
| Software & Technology Services | 19.14% – 25.49% | 66% – 72% | Labor, cloud infrastructure, R&D | Low |
| Healthcare Products & Services | 8.19% – 9.61% | 48% – 54% | Manufacturing, regulatory compliance, distribution | Moderate |
| Real Estate (General/Development) | 16.91% – 20.47% | 35% – 47% | Property acquisition, construction, financing | High |
| Restaurant & Food Service | 9.37% – 10.66% | 32% – 33% | Food costs, labor, rent | High |
| Retail (General Merchandise) | 3.09% – 5.61% | 31% – 33% | Inventory, rent, labor | Moderate |
| Retail (Specialty/E-commerce) | 5.19% – 7.55% | 30% – 35% | Inventory, shipping, marketing | Moderate |
| Professional Services | 5.45% – 7.03% | 33% – 34% | Labor, office overhead | Low |
| Construction & Trades | 1.67% – 5.94% | 14% – 15% | Materials, equipment, labor | High |
| Automotive Services & Retail | 3.36% – 4.32% | 22% | Parts, labor, facility costs | Moderate |
| Manufacturing (General) | 7.42% – 10.78% | 26% – 31% | Raw materials, production labor, equipment | Moderate |
| Agriculture & Farming | 3.91% – 7.12% | 13% – 16% | Equipment, land, weather-related costs | High |
| Transportation & Logistics | 5.96% – 8.23% | 24% – 25% | Fuel, vehicle maintenance, insurance | High |
| Entertainment & Recreation | -4.72% – 4.43% | 38% – 41% | Venue costs, talent, marketing | Very High |
| Education Services | 8.79% – 11.84% | 46% | Instructor wages, facility costs, materials | Low |
| Insurance Services | 8.88% – 12.37% | 30% – 45% | Claims, underwriting, regulatory costs | Moderate |
| Wholesale Distribution | 1.17% – 1.21% | 15% | Inventory holding, logistics, warehousing | Low |
| Advertising & Marketing | -0.30% – 0.89% | 28% – 36% | Creative labor, technology platforms | High |
| Engineering Services | 2.95% – 5.60% | 14% – 15% | Specialized labor, equipment, insurance | Moderate |
| Computer Services & IT | 4.40% – 6.63% | 24% – 25% | Technical labor, software licenses | Low |
| Household Products & Consumer Goods | 11.68% – 17.41% | 51% | Manufacturing, distribution, marketing | Moderate |
Data Collection Notes: Margin ranges reflect variation between small-scale operators (lower end) and established small businesses with optimized operations (higher end). Volatility ratings indicate typical year-over-year margin fluctuation based on economic sensitivity.
Three Key Findings:
- Technology and software businesses maintain the highest average profit margins (19%-25%), driven by low marginal costs once products are developed and minimal inventory requirements.
- Food service and construction industries face persistent margin pressure, with restaurant net margins averaging just 9%-11% despite gross margins near 32%, indicating high fixed costs and operational expenses erode profitability.
- Margin volatility correlates directly with external dependencies: businesses reliant on commodity inputs (agriculture, transportation) or discretionary consumer spending (entertainment, restaurants) experience 3-5x greater year-over-year margin fluctuation compared to stable sectors like software and professional services.
2. Small Business Profit Margin by Revenue Size – 2026
Business size significantly impacts achievable profit margins. The table below segments average net profit margins by annual revenue bracket, revealing how scale influences profitability.
Revenue size segmentationProfitability lifecycle by revenue bracket
| Annual Revenue Range | Average Net Profit Margin | Median Gross Profit Margin | Share of Small Businesses | Primary Profitability Factors |
|---|---|---|---|---|
| Under $100,000 | 5.2% | 42% | 28% | Owner labor substitution, minimal overhead |
| $100,000 – $500,000 | 7.8% | 38% | 34% | Early operational efficiency, limited staff |
| $500,000 – $1 million | 9.1% | 35% | 18% | Established customer base, optimized processes |
| $1 million – $5 million | 11.4% | 36% | 14% | Economies of scale, specialized staff |
| $5 million – $10 million | 10.2% | 37% | 4% | Increased overhead, middle management costs |
| $10 million – $50 million | 8.9% | 38% | 2% | Competitive pressure, organizational complexity |
Research Methodology: Data aggregated from U.S. Census Bureau nonemployer establishment statistics, SBA reporting, and financial institution small business lending databases covering fiscal year 2024-2025.
Below-Table Insights: Profit margins follow a predictable lifecycle pattern: margins increase steadily from startup phase through $5 million in annual revenue, peaking at 11.4% for businesses in the $1-5M range. Beyond $5 million, margins typically compress as organizational complexity increases and competitive dynamics intensify. The “sweet spot” for small business profitability appears between $500,000 and $5 million in annual revenue, where operational efficiency gains outpace overhead growth.
3. Small Business Profitability by Employee Count – 2026
Labor structure directly impacts margin performance. This table examines how staffing levels correlate with profitability.
Employee-count benchmarksMargins, revenue/employee, labor cost, complexity
| Employee Count | Average Net Profit Margin | Average Revenue Per Employee | Labor Cost as % of Revenue | Operational Complexity |
|---|---|---|---|---|
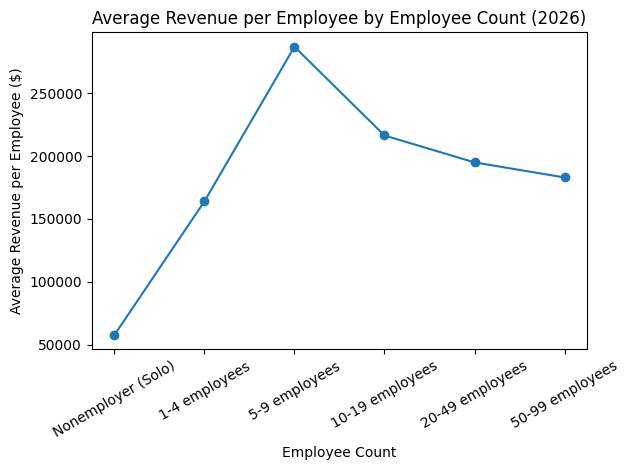
| Nonemployer (Solo) | 35.7% | $57,611 | 0% (owner labor) | Very Low |
| 1-4 employees | 12.3% | $164,000 | 32% | Low |
| 5-9 employees | 9.7% | $287,000 | 38% | Moderate |
| 10-19 employees | 8.4% | $216,400 | 42% | Moderate-High |
| 20-49 employees | 7.8% | $195,000 | 45% | High |
| 50-99 employees | 7.1% | $183,000 | 47% | Very High |
Data Source Note: Revenue per employee and labor cost percentages derived from U.S. Census Bureau Economic Census data (2024), cross-referenced with ADP payroll processing statistics for small businesses.
Key Observations: The data reveals a dramatic profitability cliff between nonemployer businesses and those with even minimal staff. Solo entrepreneurs maintain average net margins of 35.7% by substituting their own labor for paid employees, effectively converting labor costs into profit. Once businesses hire their first employee, margins drop to 12.3% and continue declining as headcount increases. This pattern reflects both increased payroll burden and rising organizational complexity. Revenue per employee peaks at 5-9 employees ($287,000), suggesting this represents an optimal efficiency point before middle management layers become necessary.
4. Profit Margin Performance by Business Model – 2026
Operational model fundamentally determines margin potential. The analysis below compares profit margins across seven common small business structures.
Business model comparisonMargin potential by structure
| Business Model | Average Net Margin | Typical Gross Margin | Capital Intensity | Scalability | Example Industries |
|---|---|---|---|---|---|
| B2B SaaS | 20.8% – 22.8% | 75% – 78% | Low | Very High | Cloud software, automation platforms, APIs |
| Service-Based (B2B) | 15.2% | 62% | Low | High | Consulting, marketing agencies, IT services |
| Service-Based (B2C) | 11.8% | 54% | Low | Moderate | Personal services, home repair, fitness |
| Product-Based (E-commerce) | 8.6% | 41% | Moderate | High | Online retail, direct-to-consumer brands |
| Product-Based (Brick & Mortar) | 5.3% | 35% | High | Low | Retail stores, specialty shops |
| Hybrid (Service + Product) | 10.4% | 48% | Moderate | Moderate | Restaurants, salons, equipment rental |
| Manufacturing | 9.8% | 31% | Very High | Moderate | Custom fabrication, food production |
Margin Calculation Context: B2B SaaS and service businesses consistently outperform product-based models due to lower inventory costs and higher gross margins. Traditional B2B SaaS achieves net margins of 20-23% with gross margins of 75-78%, though AI-first SaaS companies face margin compression (50-65% gross margins) due to inference costs.
Service models face scaling limitations tied to human capital availability, while product businesses can leverage inventory systems and distribution networks for growth.
5. Historical Trend: Small Business Profit Margins 2020-2026
The chart below tracks average net profit margin evolution across six years, revealing post-pandemic profitability patterns.
Historical trend table2020–2026 (Projected)
| Year | Average Net Margin (All Small Business) | Median Net Margin | Top Quartile (75th percentile) | Bottom Quartile (25th percentile) | Economic Context |
|---|---|---|---|---|---|
| 2020 | 4.8% | 3.2% | 11.2% | -1.4% | COVID-19 pandemic disruption |
| 2021 | 8.1% | 5.7% | 15.8% | 2.1% | Federal relief programs, pent-up demand |
| 2022 | 7.9% | 5.4% | 14.6% | 1.8% | Supply chain normalization |
| 2023 | 7.3% | 4.9% | 13.2% | 1.3% | Inflation pressure, rising interest rates |
| 2024 | 7.6% | 5.1% | 13.7% | 1.6% | Stabilization, operational adjustments |
| 2026 (Projected) | 7.8% – 8.2% | 5.3% – 5.6% | 14.1% – 14.8% | 1.7% – 2.2% | Steady growth, normalized cost environment |
Trend Analysis: Small business profitability peaked in 2021 as pandemic relief programs and suppressed competition created temporary margin expansion. Margins compressed in 2023 due to inflation-driven cost increases and higher borrowing costs, but have since stabilized. The 2026 projection reflects modest improvement as businesses adapt pricing strategies and optimize operations to offset persistent labor and material cost inflation.
6. Factors Influencing Small Business Profit Margins
Multiple variables determine whether a small business achieves above-average, average, or below-average profitability. The table below quantifies impact magnitude.
Impact factorsMagnitude, control, mechanism
| Factor | Margin Impact Range | Direction | Control Level | Primary Mechanism |
|---|---|---|---|---|
| Industry Selection | ±15 percentage points | Structural | Pre-Launch | Inherent gross margin characteristics |
| Geographic Location | ±4 percentage points | Mixed | Low | Rent, labor costs, tax rates, competition density |
| Business Age/Maturity | +2 to +8 pp over 5 years | Positive | Time | Operational efficiency, customer base stability |
| Pricing Strategy | ±6 percentage points | Positive/Negative | High | Revenue per transaction vs. volume trade-off |
| Cost Control Systems | +3 to +9 pp | Positive | Very High | Expense tracking, vendor negotiation, waste reduction |
| Labor Efficiency | ±5 percentage points | Mixed | Moderate | Revenue per employee, automation adoption |
| Inventory Management | ±3 percentage points | Mixed | High | Carrying costs, stockout prevention, turnover rate |
| Technology Adoption | +2 to +7 pp | Positive | High | Process automation, customer acquisition efficiency |
| Capital Structure | ±3 percentage points | Mixed | Moderate | Interest expense burden vs. growth capability |
| Market Positioning | ±8 percentage points | Mixed | Moderate | Premium vs. volume strategy differentiation |
Interpretation Guidance: “Control Level” indicates how much influence business owners exert over each factor. Industry selection and geographic location are largely fixed after initial business formation, while pricing strategy, cost control, and technology adoption remain actively manageable throughout business lifecycle. The highest-impact variables owners can control are pricing strategy, cost management systems, and market positioning.
Requesting a Copy of This Report
The complete small business profit margin dataset includes additional granular analysis by metropolitan statistical area, detailed expense category breakdowns, and five-year historical comparisons across 143 industry subcategories.
If you would like to request a PDF copy of the full report or learn more about Voted Number One’s business recognition platform, you can reach out through our website. Voted Number One connects consumers with exceptional local businesses while providing business owners with tools to showcase their customer-driven excellence.
Nominate your business for recognition
Community-powered credibility for exceptional local businesses.
Nominate Your Business for Recognition →
Sources
- NYU Stern School of Business — Margins by Sector (U.S.). Aswath Damodaran. Data as of January 2026. Available at: https://pages.stern.nyu.edu/~adamodar/New_Home_Page/datafile/margin.html
- SmartBiz Bank — “What Is a Good Profit Margin for a Small Business?” Small Business Banking Analysis. April 2025. Available at: https://smartbizbank.com/blog/what-is-a-good-profit-margin-for-a-small-business
- The Zebra Research — Small Business Statistics in 2026. Insurance and Financial Services Data. Available at: https://www.thezebra.com/resources/research/small-business-statistics/
- TrueProfit Analysis — “What Is A Good Profit Margin For A Small Business? (2025).” E-commerce Profitability Research. February 2026. Available at: https://trueprofit.io/blog/what-is-a-good-profit-margin-for-a-small-business
- Entrepreneurs HQ — 101 Small Business Statistics 2026 Report: Growth, Revenue & Trends. January 2026. Available at: https://entrepreneurshq.com/small-business-statistics/
- altLINE by Southern Bank — 2026 Small Business Revenue Statistics. U.S. Census Bureau Data Analysis. Available at: https://altline.sobanco.com/small-business-revenue-statistics/
- DoorDash Merchant Services — Average Profit Margin by Industry – Benchmarks for Small Business. 2026 Industry Report. Available at: https://merchants.doordash.com/en-ca/blog/average-profit-margin-by-industry
- Monetizely — “The Economics of AI-First B2B SaaS in 2026.” SaaS Margin Analysis. October 2025. Available at: https://www.getmonetizely.com/blogs/the-economics-of-ai-first-b2b-saas-in-2026
- Benchmarkit.ai — “2025 B2B SaaS Performance Metrics Benchmarks.” Private SaaS Company Data. January 2025. Available at: https://www.benchmarkit.ai/2025benchmarks